27 November 2020 - The UN-Habitat COVID-19 tracking platform, which collects data on the preparedness and response of cities and urban areas, has a new daily trending feature identifying COVID cases globally and city-based hotspots.
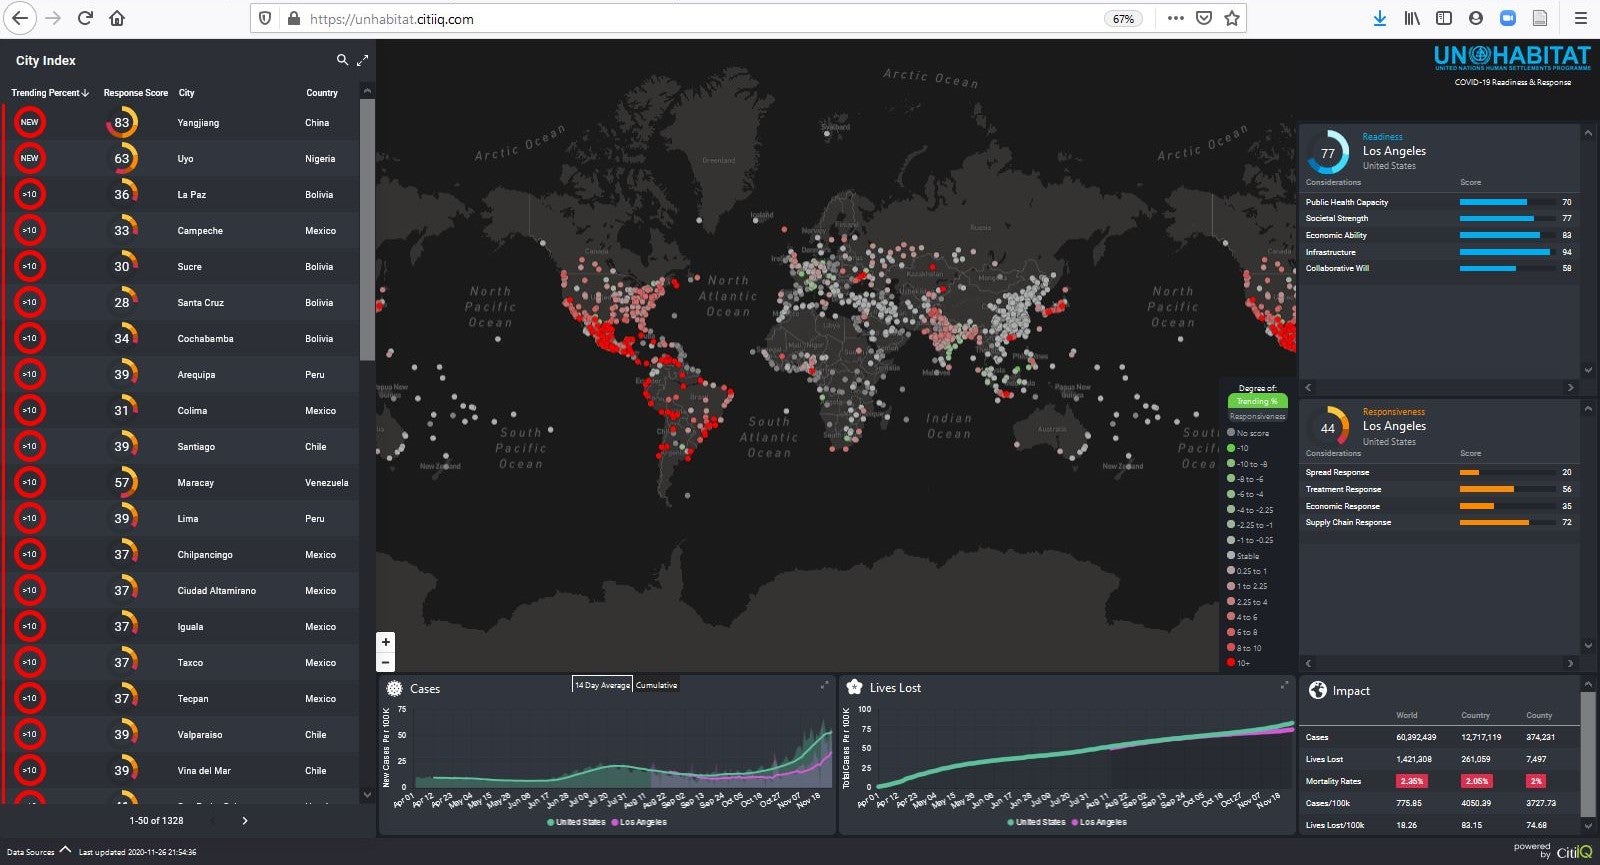
The new feature provides a worldview of the global pandemic situation on any given day with the trending value reflected as a percentage change for each city. Where cases are trending downward, the platform displays green values, an increasing number of cases displays red values and rates of change near zero are grey.
“With the front-line battle against the pandemic often fought at a city level, timely information is critical in managing scarce public resources,” said Robert Ndugwa Head of Data and Analytics for UN-Habitat. “Through this platform, UN-Habitat has offered a decision support tool based on the most current data for those helping cities around the world to combat COVID-19.”
The web-based visual platform provides a score out of 100 that represents the overall response of a city since the pandemic began. The Readiness Score is based on: public health capacity, societal strength, economic ability, infrastructure, and national collaborative will. Meanwhile the Responsiveness Score is based on: spread response, treatment response, economic response and supply chain response
This platform now covers 1,400 cities including, where data is available, cities with a population of 500,000 or higher along with country capitals and state/provincial capitals for the USA, Brazil, India, and China and allows for the addition of cities as data becomes available.
The tracker, available at https://unhabitat.citiiq.com/ is powered by the CitiIQ platform which uses a range of machine learning and analytic tools, CitiIQ makes extensive use of automation techniques to collect the COVID-19 data.